Debugging Remote Applications with Eclipse
The EMAC Eclipse distribution is pre-configured with remote debug support provided by the Debug Perspective. This eliminates the need to learn GDB's command-line when a program needs to be debugged. Remote debug support is facilitated by gdbserver on the remote machine. The following guide will provide an introduction to the use of the Eclipse Debug Perspective to step through code in a multi-threaded C/C++ application compiled for an EMAC OE product. For a general introduction to debugging and to gain a better understanding of GDB, refer to the EMAC OE SDK Debug Guide.
Introduction
This Eclipse Guide will use the pthread_demo EMAC OE SDK example project to provide instructions for the following debug tasks:
- Debug Configuration Setup
- Start a Debug Session
- Add Breakpoints
- Switch Between Threads
- Enable Scheduler-Locking Using the GDB Console
- Step Through Code
- Other Debug Tools
These lessons assume that the user has just finished editing a C source file called pthread_demo.c from the EMAC OE SDK example projects. They expose the basic debugging capability provided by the Eclipse Debug perspective, but are not intended to be a comprehensive guide to debugging in Eclipse. More information is provided by the C/C++ Development Tools plugin through a help menu. To access CDT debugging help, do the following:
- Click Help -> Help Contents
- In the Help -> Eclipse Dialog window, select C/C++ Development User Guide -> Tasks -> Running and debugging projects -> Debugging.
Debug Configuration Setup
Before switching to the Eclipse Debug Perspective, it is necessary to set up a Debug configuration that specifies the EMAC OE SDK version of GDB as the debugger. This is important because the remote target's CPU architecture must be taken into account by the debugger since each EMAC OE SDK is configured specifically for its particular target board.
The following procedure uses field values which are specific to this particular debug session. Because of this, it should be treated as an example of how to set up a Debug Configuration rather than a general guide on doing so.
-
Create a new launch configuration:
-
In the Project Explorer View, right-click the project to be run.
-
Select Debug As -> Debug Configurations... to bring up the Debug Configuration Dialog.
-
In the Type List, right-click C/C++ Remote Application and select New... from the context menu. A new configuration with the same name as the currently open project will appear. This name can be changed in the top leftmost text field labeled Name:. The examples below use the name pthread_demo.
-
-
For instructions relating to fields in the main tab, refer to Figure 1 below.
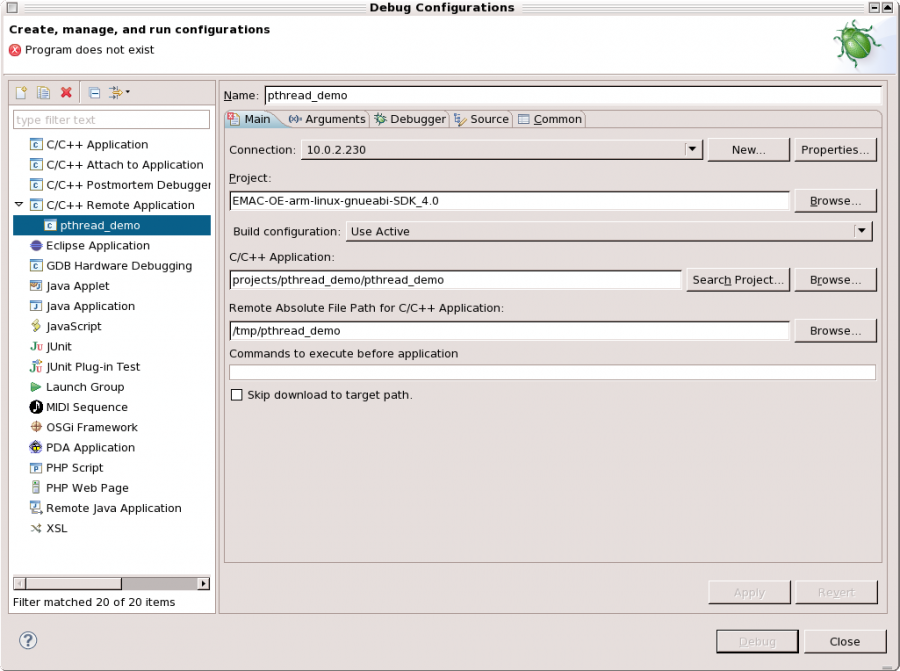 Figure 1: Debug Configuration Main Tab
-
Choose a connection from the Connection: drop-down menu or click New... to create a new one.
-
The default for the Project: field will be the currently-active project. If this is not the EMAC SDK project or if your source code is contained in another project, click Browse... to choose the correct project.
-
Choose a value for the C/C++ Application: using one of the methods listed below:
-
Type projects/pthread_demo/pthread_demo in the text field provided. Note that this text field takes the path relative to a project's root directory.
-
Use Search Project... to initiate a search dialog. Type
pthread_demoto search for the application binary. -
Manually browse the file system to find the
pthread_demoexecutable using Browse....
-
-
Choose a value for Remote Absolute File Path for C/C++ Application:. When uploading the application using the EMAC SDK Makefile, this location is
/tmp/pthread_demo. This can be done one of two ways:-
Type the location in the provided text field.
-
Select Browse... to search the remote file system for the target binary. Note that this step required the value of the Connection: field to be set to a valid connection and the development machine to be connected to the target machine.
-
-
-
For instructions relating to the Arguments tab, refer to Figure 2 below.
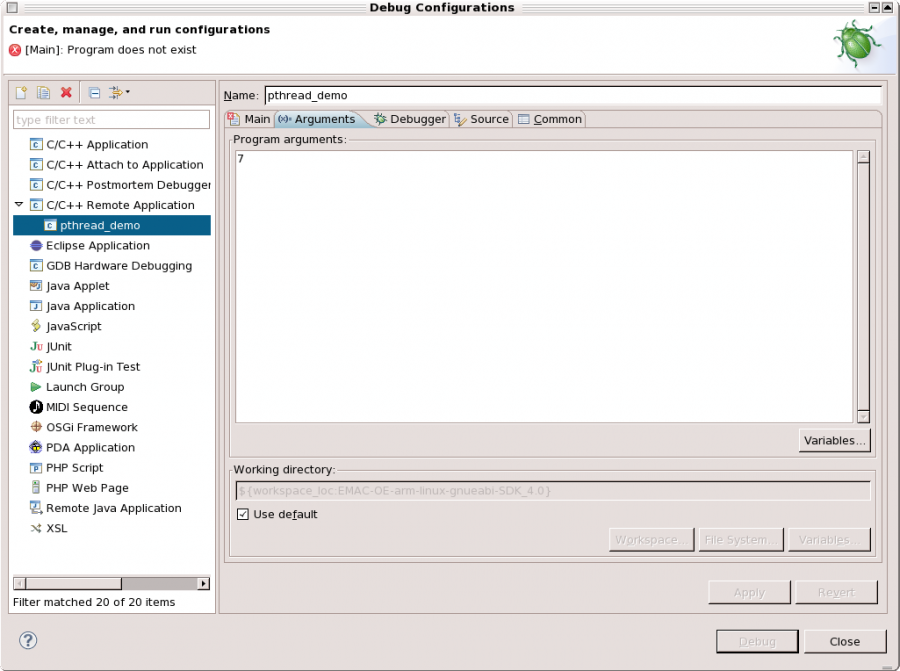 Figure 2: Debug Configuration Arguments Tab
If the application being debugged takes any command-line arguments, they must be entered in the Program arguments: field as shown above. For this debug session, the program takes a single integer argument as if the following command were run in a remote shell:
root@emac-oe:~# /tmp/pthread_demo 7To achieve the same effect in the Debug Configuration, the Program Arguments: field must contain the value '7'.
-
For instructions relating to the Debugger tab, refer to Figure 3 below.
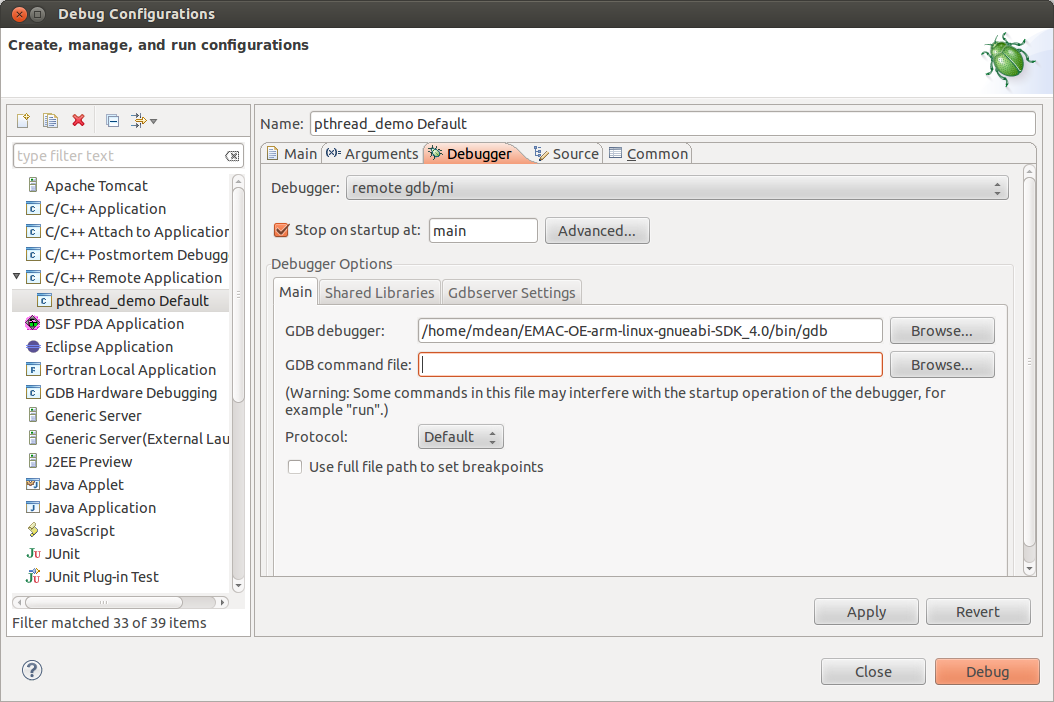 Figure 3: Debug Configuration Debugger Tab
-
Select remote gdb/mi from the Debugger: drop-down menu.
-
In the Debugger Options frame under the Main tab, change the GDB Debugger: setting to the following:
/path/to/sdk/gcc-4.2.4-arm-linux-gnueabi/bin/arm-linux-gnueabi-gdb.

Note that this value will vary depending on the SDK used, particularly for SDKs targeting architectures other than ARM. -
Delete the default GDB command file: value as this will not be used during the debug session.
-
-
Click Apply when the above changes have been implemented.


