Difference between revisions of "Debugging Remote Applications with Eclipse"
(added some temporary testing code in a comment) |
|||
| (22 intermediate revisions by 5 users not shown) | |||
| Line 1: | Line 1: | ||
| − | The | + | {{todo|SEOKWREV(11.06.13-11:32->JG+) Polish this (10.29.13-12:45->MG+) (10.30.13-16:25->MD+) (03.04.14-17:00->BS-) (03.26.14-16:40->BS+)|Michael Gloff|project=oe 4,mg,md,bs,SEOKWREV}} |
| + | |||
| + | {{#seo: | ||
| + | |title=Debugging Remote Applications with Eclipse | ||
| + | |titlemode=append | ||
| + | |keywords=Debugging,Remote Applications,Eclipse,EMAC OE SDK,Debug Configuration Setup | ||
| + | |description=Debugging remote applications with Eclipse. | ||
| + | }} | ||
| + | The Eclipse distribution is pre-configured with remote debug support provided by the Debug Perspective. This eliminates the need to learn GDB's command-line when a program needs to be debugged. Remote debug support is facilitated by gdbserver on the remote machine. The following guide will provide an introduction to the use of the Eclipse Debug Perspective to step through code in a multi-threaded C/C++ application compiled for an EMAC OE product. For a general introduction to debugging and to gain a better understanding of GDB, refer to the [[Remote Debugging EMAC OE SDK Projects with gdbserver|EMAC OE SDK Debug Guide]]. | ||
| + | |||
| + | <br clear=all> | ||
== Introduction == | == Introduction == | ||
| Line 12: | Line 22: | ||
# Other Debug Tools | # Other Debug Tools | ||
| − | These lessons assume that the user has just finished editing a C source file called <code>pthread_demo.c</code> from the EMAC OE SDK example projects. They expose the basic debugging capability provided by the Eclipse Debug perspective, but are not intended to be a comprehensive guide to debugging in Eclipse. More information is provided by the C/C++ Development Tools plugin through a help menu. To access CDT debugging help, do the following: | + | These lessons assume that the user has just finished editing a C source file called <code>pthread_demo.c</code> from the EMAC OE SDK example projects. They expose the basic debugging capability provided by the Eclipse Debug perspective, but are not intended to be a comprehensive guide to debugging in Eclipse. More information is provided by the C/C++ Development Tools plugin through a [[help]] menu. To access CDT debugging [[help]], do the following: |
| − | # Click ''Help -> Help Contents'' | + | # Click ''[[Help]] -> [[Help]] Contents'' |
| − | # In the ''Help -> Eclipse'' Dialog window, select ''C/C++ Development User Guide -> Tasks -> Running and debugging projects -> Debugging''. | + | # In the ''[[Help]] -> Eclipse'' Dialog window, select ''C/C++ Development User Guide -> Tasks -> Running and debugging projects -> Debugging''. |
| + | |||
| + | <br clear=all> | ||
== Debug Configuration Setup == | == Debug Configuration Setup == | ||
Before switching to the Eclipse Debug Perspective, it is necessary to set up a Debug configuration that specifies the EMAC OE SDK version of GDB as the debugger. This is important because the remote target's CPU architecture must be taken into account by the debugger since each EMAC OE SDK is configured specifically for its particular target board. | Before switching to the Eclipse Debug Perspective, it is necessary to set up a Debug configuration that specifies the EMAC OE SDK version of GDB as the debugger. This is important because the remote target's CPU architecture must be taken into account by the debugger since each EMAC OE SDK is configured specifically for its particular target board. | ||
| − | The following procedure uses field values which are specific to this particular debug session. Because of this, it should be treated as an example of how to set up a Debug Configuration rather than a general guide | + | The following procedure uses field values which are specific to this particular debug session. Because of this, it should be treated as an example of how to set up a Debug Configuration rather than a general guide for doing so. |
<cl> | <cl> | ||
| Line 27: | Line 39: | ||
* In the ''Type List'', right-click ''C/C++ Remote Application'' and select ''New...'' from the context menu. A new configuration with the same name as the currently open project will appear. This name can be changed in the top leftmost text field labeled ''Name:''. The examples below use the name ''pthread_demo''. | * In the ''Type List'', right-click ''C/C++ Remote Application'' and select ''New...'' from the context menu. A new configuration with the same name as the currently open project will appear. This name can be changed in the top leftmost text field labeled ''Name:''. The examples below use the name ''pthread_demo''. | ||
| − | * For instructions relating to fields in the main tab, refer to Figure 1 below. | + | * For instructions relating to fields in the main tab, refer to Figure 1 below. |
| − | + | i. Choose a connection from the ''Connection:'' drop-down menu or click ''New...'' to [[Remote System Explorer Setup for Eclipse#Create a Remote Connection|create a new one]]. | |
| − | i. Choose a connection from the ''Connection:'' drop-down menu or click ''New...'' to [[Remote System Explorer Setup for | ||
* The default for the ''Project:'' field will be the currently-active project. If this is not the EMAC SDK project or if your source code is contained in another project, click ''Browse...'' to choose the correct project. | * The default for the ''Project:'' field will be the currently-active project. If this is not the EMAC SDK project or if your source code is contained in another project, click ''Browse...'' to choose the correct project. | ||
* Choose a value for the ''C/C++ Application:'' using one of the methods listed below: | * Choose a value for the ''C/C++ Application:'' using one of the methods listed below: | ||
| Line 37: | Line 48: | ||
* Choose a value for ''Remote Absolute File Path for C/C++ Application:''. When uploading the application using the EMAC SDK Makefile, this location is <code>/tmp/pthread_demo</code>. This can be done one of two ways: | * Choose a value for ''Remote Absolute File Path for C/C++ Application:''. When uploading the application using the EMAC SDK Makefile, this location is <code>/tmp/pthread_demo</code>. This can be done one of two ways: | ||
* Type the location in the provided text field. | * Type the location in the provided text field. | ||
| − | * Select ''Browse...'' to search the remote file system for the target binary. | + | * Select ''Browse...'' to search the remote file system for the target binary. This step requires the value of the ''Connection:'' field to be set to a valid connection and the development machine to be connected to the target machine. |
| + | |||
| + | [[File:EMAC_Eclipse_Remote_Debug_Configuration.png|600px|thumb|left|Figure 1: Debug Configuration Main Tab ]] | ||
| + | |||
| + | <br clear=all> | ||
* For instructions relating to the Arguments tab, refer to Figure 2 below. | * For instructions relating to the Arguments tab, refer to Figure 2 below. | ||
| − | + | If the application being debugged takes any command-line arguments, they must be entered in the ''Program arguments:'' field. For this debug session, the program takes a single integer argument as if the following command were run in a remote shell: | |
| − | If the application being debugged takes any command-line arguments, they must be entered in the ''Program arguments:'' field | ||
<syntaxhighlight lang="bash"> | <syntaxhighlight lang="bash"> | ||
root@emac-oe:~# /tmp/pthread_demo 7 | root@emac-oe:~# /tmp/pthread_demo 7 | ||
</syntaxhighlight> | </syntaxhighlight> | ||
To achieve the same effect in the Debug Configuration, the ''Program Arguments:'' field must contain the value '7'. | To achieve the same effect in the Debug Configuration, the ''Program Arguments:'' field must contain the value '7'. | ||
| + | |||
| + | [[File:EMAC_Eclipse_Remote_Debug_Arguments.png|left|thumb|600px|Figure 2: Debug Configuration Arguments Tab]] | ||
| + | |||
| + | <br clear=all> | ||
* For instructions relating to the Debugger tab, refer to Figure 3 below. | * For instructions relating to the Debugger tab, refer to Figure 3 below. | ||
| − | + | i. Select ''remote gdb/mi'' from the ''Debugger:'' drop-down menu. | |
| − | + | * In the ''Debugger Options'' frame under the ''Main'' tab, change the ''GDB Debugger:'' setting to the following: <code>/path/to/sdk/gcc-4.2.4-arm-linux-gnueabi/bin/arm-linux-gnueabi-gdb</code>. | |
| − | + | {{mbox | type = notice | text = Note that this value will vary depending on the SDK used, particularly for SDKs targeting architectures other than ARM.}} | |
| − | {{mbox | type = notice | text = Note that this value will vary depending on the SDK used, particularly for SDKs targeting architectures other than ARM.}} | + | * Delete the default ''GDB command file:'' value as this will not be used during the debug session. |
| − | + | ||
| + | [[File:EMAC_Eclipse_Remote_Debug_Debugger.png|left|thumb|600px|Figure 3: Debug Configuration Debugger Tab]] | ||
| + | |||
| + | <br clear=all> | ||
* Click ''Apply'' when the above changes have been implemented. | * Click ''Apply'' when the above changes have been implemented. | ||
| Line 69: | Line 90: | ||
Depending on the project settings, Eclipse may attempt to perform a build as its first step. Otherwise, it will continue to the next step which is to upload the binary to the location in the remote file system specified in the Debug Configuration. It will then run that program attached to <code>gdbserver</code>. Eclipse will then run the SDK's architecture-specific version of GDB with the remote target specified by the hostname in the Remote Connection and the port specified in the Debug Configuration. Once all this is done, Eclipse will activate a prompt to determine whether or not it should automatically switch to the Debug Perspective. Answer yes to arrive at the workspace shown in Figure 4 below. | Depending on the project settings, Eclipse may attempt to perform a build as its first step. Otherwise, it will continue to the next step which is to upload the binary to the location in the remote file system specified in the Debug Configuration. It will then run that program attached to <code>gdbserver</code>. Eclipse will then run the SDK's architecture-specific version of GDB with the remote target specified by the hostname in the Remote Connection and the port specified in the Debug Configuration. Once all this is done, Eclipse will activate a prompt to determine whether or not it should automatically switch to the Debug Perspective. Answer yes to arrive at the workspace shown in Figure 4 below. | ||
| − | |||
| + | [[File:EMAC_Eclipse_Remote_Debug_Init.png|left|thumb|600px|Figure 4: Debug Session Initial Screen]] | ||
| + | |||
| + | <br clear=all> | ||
=== Lesson 2: Add Breakpoints === | === Lesson 2: Add Breakpoints === | ||
After starting the debug session, the next step is to add breakpoints. The procedure below covers this topic. | After starting the debug session, the next step is to add breakpoints. The procedure below covers this topic. | ||
| + | |||
<cl> | <cl> | ||
1. In the upper-right frame of Eclipse Views, the Variable View should be showing. Click the Breakpoints View tab to bring it into focus in that frame. | 1. In the upper-right frame of Eclipse Views, the Variable View should be showing. Click the Breakpoints View tab to bring it into focus in that frame. | ||
| Line 81: | Line 105: | ||
* Select ''Toggle Breakpoint'' to toggle a breakpoint for that line. This causes a check mark to appear to the left of the line number as shown in Figure 5. Note that the same effect can be achieved by double-clicking the line number. Also notice that the Debug Perspective C/C++ Editor is the same editor used within the C/C++ Perspective. Because the editors are the same, the functionality of toggling breakpoints is available in the C/C++ Perspective as well as the Debug Perspective. | * Select ''Toggle Breakpoint'' to toggle a breakpoint for that line. This causes a check mark to appear to the left of the line number as shown in Figure 5. Note that the same effect can be achieved by double-clicking the line number. Also notice that the Debug Perspective C/C++ Editor is the same editor used within the C/C++ Perspective. Because the editors are the same, the functionality of toggling breakpoints is available in the C/C++ Perspective as well as the Debug Perspective. | ||
* Repeat steps 3-5 for lines <code>119</code> and <code>165</code>. Notice that each breakpoint shows up in the Breakpoints view. Right-clicking on either of these breakpoints will pull up a context menu that provides control similar to right-clicking on the breakpoint's line number. These breakpoints are local to the project being debugged so they will persist across debug sessions until removed manually in the Breakpoints View. | * Repeat steps 3-5 for lines <code>119</code> and <code>165</code>. Notice that each breakpoint shows up in the Breakpoints view. Right-clicking on either of these breakpoints will pull up a context menu that provides control similar to right-clicking on the breakpoint's line number. These breakpoints are local to the project being debugged so they will persist across debug sessions until removed manually in the Breakpoints View. | ||
| − | [[File:EMAC_Eclipse_Remote_Debug_Add_Breakpoints.png| | + | |
| + | [[File:EMAC_Eclipse_Remote_Debug_Add_Breakpoints.png|left|thumb|600px|Figure 5: Add Breakpoints in Debug Perspective]] | ||
| + | |||
| + | <br clear=all> | ||
| + | |||
* After setting the breakpoints, click ''Run -> Resume''. The program will continue until the first breakpoint, which is line <code>165</code> in the generator thread. This will yield a workbench similar to what is shown in Figure 6 below. The main thread will be suspended somewhere within the call to <code>pthread_create()</code>. Note the thread number in brackets. This uniquely identifies threads within a program so that they may be distinguished from one another during the debug session. | * After setting the breakpoints, click ''Run -> Resume''. The program will continue until the first breakpoint, which is line <code>165</code> in the generator thread. This will yield a workbench similar to what is shown in Figure 6 below. The main thread will be suspended somewhere within the call to <code>pthread_create()</code>. Note the thread number in brackets. This uniquely identifies threads within a program so that they may be distinguished from one another during the debug session. | ||
| − | [[File:EMAC_Eclipse_Remote_Debug_New_Thread.png| | + | |
| + | [[File:EMAC_Eclipse_Remote_Debug_New_Thread.png|left|thumb|600px|Figure 6: Newly Created <code>generator</code> Thread]] | ||
| + | |||
| + | <br clear=all> | ||
</cl> | </cl> | ||
=== Lesson 3: Switch Between Threads === | === Lesson 3: Switch Between Threads === | ||
After adding breakpoints, the next task is to learn how to switch between threads. The procedure below covers this topic. | After adding breakpoints, the next task is to learn how to switch between threads. The procedure below covers this topic. | ||
| + | |||
<cl> | <cl> | ||
1. In the Debug View, the following thread should currently be selected: ''pthread_demo [C/C++ Remote Application] -> gdbserver debugger (<date> <time>) (Suspended) -> Thread [2] (Suspended: Breakpoint hit.) -> 3 generator() pthread_demo.c:165 <hex location>'' | 1. In the Debug View, the following thread should currently be selected: ''pthread_demo [C/C++ Remote Application] -> gdbserver debugger (<date> <time>) (Suspended) -> Thread [2] (Suspended: Breakpoint hit.) -> 3 generator() pthread_demo.c:165 <hex location>'' | ||
This is the third stack frame in the second thread of the pthread_demo application. It is currently selected in the Eclipse Debug view because it hit the breakpoint at line <code>165</code>. | This is the third stack frame in the second thread of the pthread_demo application. It is currently selected in the Eclipse Debug view because it hit the breakpoint at line <code>165</code>. | ||
* In the Eclipse window frame (not to be confused with a stack frame) which contains the Variables and Breakpoints Views, select the Variables View. Notice that the currently-selected stack frame will always be the one whose variables are shown in this view. In terms relevant to source code, a stack frame for a particular function is where its local variables are stored in the process's virtual memory space. | * In the Eclipse window frame (not to be confused with a stack frame) which contains the Variables and Breakpoints Views, select the Variables View. Notice that the currently-selected stack frame will always be the one whose variables are shown in this view. In terms relevant to source code, a stack frame for a particular function is where its local variables are stored in the process's virtual memory space. | ||
| − | * Expand ''Thread [1] (Suspended)'' as shown in Figure 7 | + | * Expand ''Thread [1] (Suspended)'' as shown in Figure 7. Notice the similarity between the hex location of the current instruction in this thread and that of the first stack frame in Thread 2. These memory locations are similar because this is where the new thread splits off from the main thread. Also, note that the variables shown in the Variable View differ between these two stack frames as described in Step 2. |
| − | + | ||
| − | Notice the similarity between the hex location of the current instruction in this thread and that of the first stack frame in Thread 2. These memory locations are similar because this is where the new thread splits off from the main thread. Also, note that the variables shown in the Variable View differ between these two stack frames as described in Step 2. | + | [[File:EMAC_Eclipse_Remote_Debug_Thread_Branch_Address.png|left|thumb|600px|Figure 7: Newly Created Thread Branch Address]] |
| + | |||
| + | <br clear=all> | ||
</cl> | </cl> | ||
| Line 101: | Line 135: | ||
<cl> | <cl> | ||
| − | 1. In the Console View, select the console connected to the GDB console from the ''Display Selected Console'' icon as shown in Figure 8 below. | + | 1. In the Console View, select the console connected to the GDB console from the ''Display Selected Console'' icon as shown in Figure 8 below. Note that the GDB console may or may not be the third console as seen in Figure 8. The GDB session can be identified by the correct EMAC OE SDK path to the GDB binary used by Eclipse to execute the program. |
| − | |||
| − | Note that the GDB console may or may not be the third console as seen in Figure 8. The GDB session can be identified by the correct EMAC OE SDK path to the GDB binary used by Eclipse to execute the program. | ||
* In the Console View, enter the following command: | * In the Console View, enter the following command: | ||
<syntaxhighlight lang=gdb> | <syntaxhighlight lang=gdb> | ||
| Line 110: | Line 142: | ||
This command ensures that the Step Into (F5) and Step Over (F6) commands only apply to the thread currently selected in the Debug View. | This command ensures that the Step Into (F5) and Step Over (F6) commands only apply to the thread currently selected in the Debug View. | ||
* Click the Resume button in the Workbench: [[File:EMAC_Eclipse_Debug_Controls_Resume_Icon.png|Debug Resume Icon]]. This will cause the <code>main</code> thread to iteratively create all the <code>reader</code> threads then suspend for the breakpoint at line 119. Each <code>reader</code> thread will suspend at line 129. | * Click the Resume button in the Workbench: [[File:EMAC_Eclipse_Debug_Controls_Resume_Icon.png|Debug Resume Icon]]. This will cause the <code>main</code> thread to iteratively create all the <code>reader</code> threads then suspend for the breakpoint at line 119. Each <code>reader</code> thread will suspend at line 129. | ||
| + | |||
| + | [[File:EMAC_Eclipse_Remote_Debug_Switching_Console_Views.png|left|thumb|600px|Figure 8: Switching Console Views]] | ||
| + | |||
| + | <br clear=all> | ||
</cl> | </cl> | ||
| Line 121: | Line 157: | ||
* Click ''Window -> View -> Disassembly''. This will switch to the Disassembly View in the frame which contains the Outline View. | * Click ''Window -> View -> Disassembly''. This will switch to the Disassembly View in the frame which contains the Outline View. | ||
* In the Debug View, click the Step Over button: [[File:EMAC_Eclipse_Debug_Controls_Step_Over_Icon.png|Debug Step Over Icon]]. Watch the Editor containing <code>pthread_demo.c</code> and the Disassembly View while doing this. Notice that the currently-running line in both the <code>pthread_demo.c</code> Editor and the Disassembly View is highlighted. The highlighted line in the Disassembly view advances each time the Step Over command is given while the highlighted line in <code>pthread_demo.c</code> remains on the statement to which each of the Disassembly View highlighted lines correspond. | * In the Debug View, click the Step Over button: [[File:EMAC_Eclipse_Debug_Controls_Step_Over_Icon.png|Debug Step Over Icon]]. Watch the Editor containing <code>pthread_demo.c</code> and the Disassembly View while doing this. Notice that the currently-running line in both the <code>pthread_demo.c</code> Editor and the Disassembly View is highlighted. The highlighted line in the Disassembly view advances each time the Step Over command is given while the highlighted line in <code>pthread_demo.c</code> remains on the statement to which each of the Disassembly View highlighted lines correspond. | ||
| − | * Continue stepping over until line 165 is reached once more in the <code>generator</code> thread. This will ensure that the <code>generator </code>thread has given up the mutex lock. For a detailed description of what a mutex | + | * Continue stepping over until line 165 is reached once more in the <code>generator</code> thread. This will ensure that the <code>generator </code>thread has given up the mutex lock. For a detailed description of what a mutex is, please see the [[Remote Debugging EMAC OE SDK Projects with gdbserver#Lesson 3: Debugging With Threads|EMAC OE SDK Debug Walkthrough Lesson 3]]. |
| − | * Select one of the <code>reader</code> threads. These are the threads whose thread number is 3 or greater in the Debug View. Step from line 129 to line 138. Notice that the <code>reader</code> locks the mutex | + | * Select one of the <code>reader</code> threads. These are the threads whose thread number is 3 or greater in the Debug View. Step from line 129 to line 138. Notice that the <code>reader</code> locks the mutex before reading or accessing it. It also unlocks the mutex before exiting. To see the output of <code>generator</code> and <code>reader</code> threads, switch the Console View entry with "Remote Shell" specified at the end as shown above in Figure 8. |
* To generate a new random number, select the <code>generator</code> thread once more. Then click the Resume button or press F8. This will cause the <code>generator</code> thread to iterate through its while loop until it reaches the <code>usleep()</code> call at line 165 once more. | * To generate a new random number, select the <code>generator</code> thread once more. Then click the Resume button or press F8. This will cause the <code>generator</code> thread to iterate through its while loop until it reaches the <code>usleep()</code> call at line 165 once more. | ||
* Repeat steps 5 and 6 until each of the <code>reader</code> threads have made a call to <code>pthread_exit()</code>. | * Repeat steps 5 and 6 until each of the <code>reader</code> threads have made a call to <code>pthread_exit()</code>. | ||
| Line 154: | Line 190: | ||
=== Using the Memory Monitor === | === Using the Memory Monitor === | ||
| + | |||
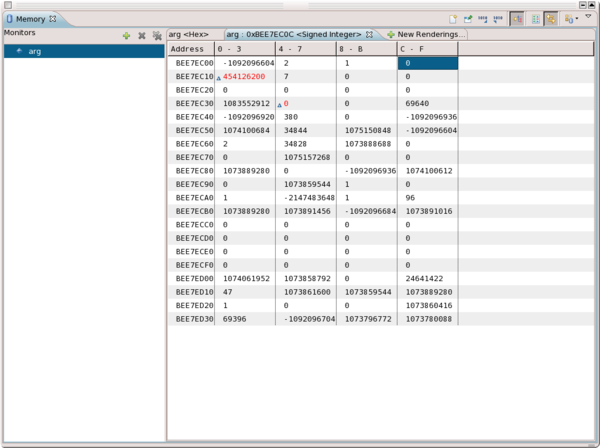
The Memory Monitor is a tool that allows the developer to see changes to adjacent portions of memory while stepping through source code. The changes show up as memory values highlighted in red as seen below in Figure 9. | The Memory Monitor is a tool that allows the developer to see changes to adjacent portions of memory while stepping through source code. The changes show up as memory values highlighted in red as seen below in Figure 9. | ||
| − | |||
{{mbox | type = notice | text = Note that the Memory Monitor View normally appears in the same Eclipse workbench frame as the Console view but was enlarged and singled out for demonstration in this guide.}} | {{mbox | type = notice | text = Note that the Memory Monitor View normally appears in the same Eclipse workbench frame as the Console view but was enlarged and singled out for demonstration in this guide.}} | ||
| + | |||
| + | <br clear=all> | ||
| + | |||
| + | [[File:EMAC_Eclipse_Remote_Debug_Memory_Monitor.png|left|thumb|600px|Figure 9: Memory Monitor View]] | ||
| + | |||
| + | <br clear=all> | ||
To view a specific location in memory corresponding to a program variable: | To view a specific location in memory corresponding to a program variable: | ||
# Activate the ''Variable View'' in the Eclipse workbench. | # Activate the ''Variable View'' in the Eclipse workbench. | ||
# Right-click on the Variable whose location is to be examined, then select ''View Memory'' in the context menu. | # Right-click on the Variable whose location is to be examined, then select ''View Memory'' in the context menu. | ||
| + | <br clear=all> | ||
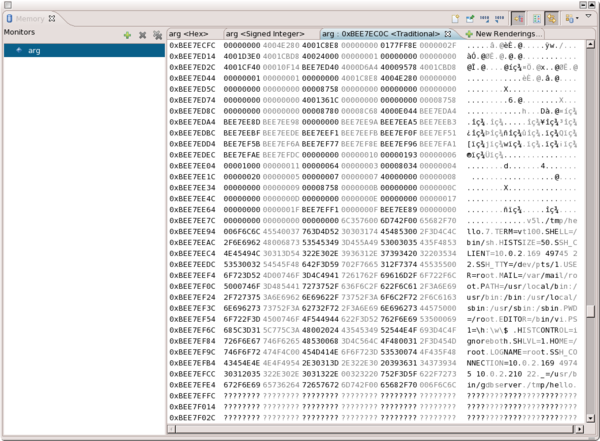
The Memory Monitor can support multiple "Renderings" of a particular memory location. Each type of rendering is a different way to represent the values of the memory locations. Memory locations can be viewed as Hex, ASCII, Signed Integer, Unsigned Integer, Hex Integer, or Traditional. To view a different rendering of the same memory location, click the ''New Renderings...'' tab in the Memory Monitor View. Figure 10 below shows the "Traditional" Rendering which shows three panes: Address, Binary, and Text. | The Memory Monitor can support multiple "Renderings" of a particular memory location. Each type of rendering is a different way to represent the values of the memory locations. Memory locations can be viewed as Hex, ASCII, Signed Integer, Unsigned Integer, Hex Integer, or Traditional. To view a different rendering of the same memory location, click the ''New Renderings...'' tab in the Memory Monitor View. Figure 10 below shows the "Traditional" Rendering which shows three panes: Address, Binary, and Text. | ||
| − | [[File:EMAC_Eclipse_Remote_Debug_Memory_Monitor_Traditional.png| | + | |
| + | [[File:EMAC_Eclipse_Remote_Debug_Memory_Monitor_Traditional.png|left|thumb|600px|Figure 10: Traditional Rendering]] | ||
| + | |||
| + | <br clear=all> | ||
=== The Disassembly View === | === The Disassembly View === | ||
| Line 177: | Line 223: | ||
{{mbox | type = warning | text = Be careful when changing register values as this can drastically alter the functioning of the system. In particular, care should be taken with instruction and data addresses. Modifying these values requires advanced knowledge of the relationship between CPU architecture, physical memory, and the operating system's virtual memory.}} | {{mbox | type = warning | text = Be careful when changing register values as this can drastically alter the functioning of the system. In particular, care should be taken with instruction and data addresses. Modifying these values requires advanced knowledge of the relationship between CPU architecture, physical memory, and the operating system's virtual memory.}} | ||
| − | == | + | == See Also == |
| − | + | * [[Eclipse Introduction]] | |
| + | * [[Installing Eclipse]] | ||
| + | * [[Configuring Eclipse]] | ||
| + | * [[Using the Eclipse Terminal View]] | ||
| + | * [[Eclipse_Remote_System_Explorer|Remote System Explorer]] | ||
| + | ** [[Remote System Explorer Setup for Eclipse|RSE Setup]] | ||
| + | ** [[Remote System Explorer SFTP Setup for Eclipse|RSE SFTP Setup]] | ||
| + | ** [[Remote System Explorer Shell and Terminal Setup|Remote Shell and Terminal Setup]] | ||
| + | *[[ Executing_Remote_Applications_with_Eclipse | Execute Remote Applications ]] | ||
| + | *[[ Remote Debugging EMAC OE SDK Projects with gdbserver| EMAC OE SDK Debugging Guide ]] | ||
| − | + | [[Category:Eclipse]] | |
| − | |||
| − | |||
| − | |||
| − | |||
| − | |||
| − | [[Category: | ||
Latest revision as of 16:39, 26 March 2014
The Eclipse distribution is pre-configured with remote debug support provided by the Debug Perspective. This eliminates the need to learn GDB's command-line when a program needs to be debugged. Remote debug support is facilitated by gdbserver on the remote machine. The following guide will provide an introduction to the use of the Eclipse Debug Perspective to step through code in a multi-threaded C/C++ application compiled for an EMAC OE product. For a general introduction to debugging and to gain a better understanding of GDB, refer to the EMAC OE SDK Debug Guide.
Contents
Introduction
This Eclipse Guide will use the pthread_demo EMAC OE SDK example project to provide instructions for the following debug tasks:
- Debug Configuration Setup
- Start a Debug Session
- Add Breakpoints
- Switch Between Threads
- Enable Scheduler-Locking Using the GDB Console
- Step Through Code
- Other Debug Tools
These lessons assume that the user has just finished editing a C source file called pthread_demo.c from the EMAC OE SDK example projects. They expose the basic debugging capability provided by the Eclipse Debug perspective, but are not intended to be a comprehensive guide to debugging in Eclipse. More information is provided by the C/C++ Development Tools plugin through a help menu. To access CDT debugging help, do the following:
- Click Help -> Help Contents
- In the Help -> Eclipse Dialog window, select C/C++ Development User Guide -> Tasks -> Running and debugging projects -> Debugging.
Debug Configuration Setup
Before switching to the Eclipse Debug Perspective, it is necessary to set up a Debug configuration that specifies the EMAC OE SDK version of GDB as the debugger. This is important because the remote target's CPU architecture must be taken into account by the debugger since each EMAC OE SDK is configured specifically for its particular target board.
The following procedure uses field values which are specific to this particular debug session. Because of this, it should be treated as an example of how to set up a Debug Configuration rather than a general guide for doing so.
-
Create a new launch configuration:
-
In the Project Explorer View, right-click the project to be run.
-
Select Debug As -> Debug Configurations... to bring up the Debug Configuration Dialog.
-
In the Type List, right-click C/C++ Remote Application and select New... from the context menu. A new configuration with the same name as the currently open project will appear. This name can be changed in the top leftmost text field labeled Name:. The examples below use the name pthread_demo.
-
-
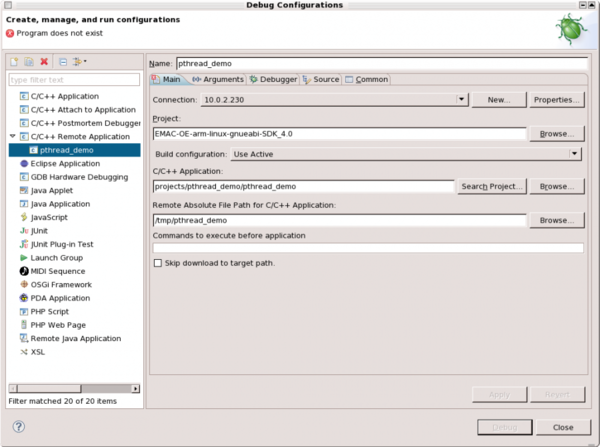
For instructions relating to fields in the main tab, refer to Figure 1 below.
-
Choose a connection from the Connection: drop-down menu or click New... to create a new one.
-
The default for the Project: field will be the currently-active project. If this is not the EMAC SDK project or if your source code is contained in another project, click Browse... to choose the correct project.
-
Choose a value for the C/C++ Application: using one of the methods listed below:
-
Type projects/pthread_demo/pthread_demo in the text field provided. Note that this text field takes the path relative to a project's root directory.
-
Use Search Project... to initiate a search dialog. Type
pthread_demoto search for the application binary. -
Manually browse the file system to find the
pthread_demoexecutable using Browse....
-
-
Choose a value for Remote Absolute File Path for C/C++ Application:. When uploading the application using the EMAC SDK Makefile, this location is
/tmp/pthread_demo. This can be done one of two ways:-
Type the location in the provided text field.
-
Select Browse... to search the remote file system for the target binary. This step requires the value of the Connection: field to be set to a valid connection and the development machine to be connected to the target machine.
-
-
-
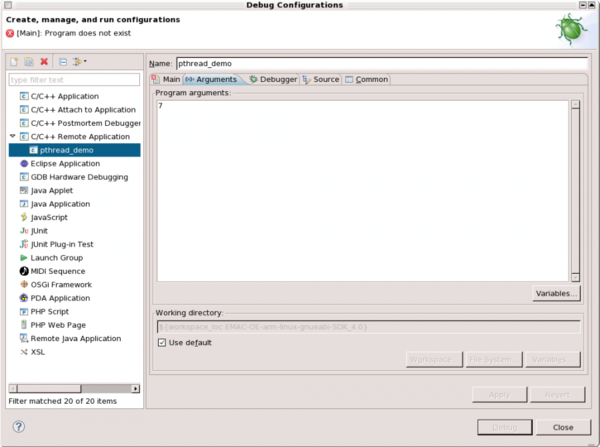
For instructions relating to the Arguments tab, refer to Figure 2 below. If the application being debugged takes any command-line arguments, they must be entered in the Program arguments: field. For this debug session, the program takes a single integer argument as if the following command were run in a remote shell:
root@emac-oe:~# /tmp/pthread_demo 7To achieve the same effect in the Debug Configuration, the Program Arguments: field must contain the value '7'.
-
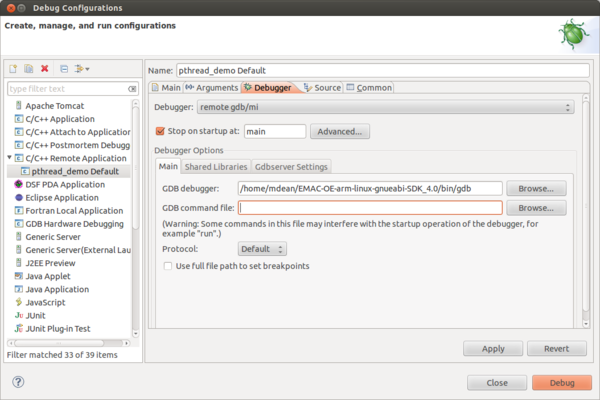
For instructions relating to the Debugger tab, refer to Figure 3 below.
-
Select remote gdb/mi from the Debugger: drop-down menu.
-
In the Debugger Options frame under the Main tab, change the GDB Debugger: setting to the following:
/path/to/sdk/gcc-4.2.4-arm-linux-gnueabi/bin/arm-linux-gnueabi-gdb.
Note that this value will vary depending on the SDK used, particularly for SDKs targeting architectures other than ARM. -
Delete the default GDB command file: value as this will not be used during the debug session.
-
-
Click Apply when the above changes have been implemented.
Walkthrough
The following lessons are intended to be run sequentially. Together they demonstrate one possible work flow for using the Eclipse Debug Perspective.
Lesson 1: Start a Debug Session
From the Eclipse workspace:
- Click Run -> Debug Configurations...
- Select C/C++ Remote Application -> pthread_demo from the filter in the Debug Configurations dialog window
- Click Debug
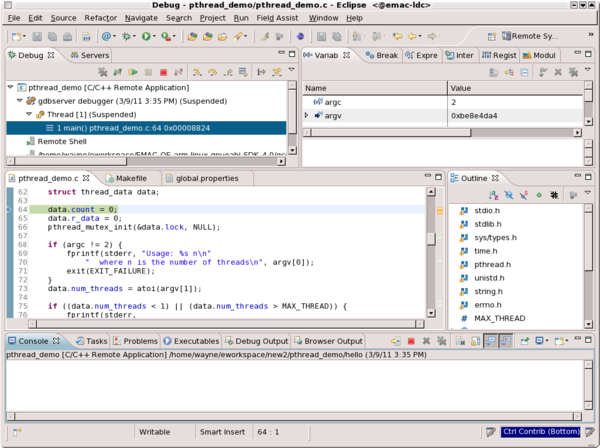
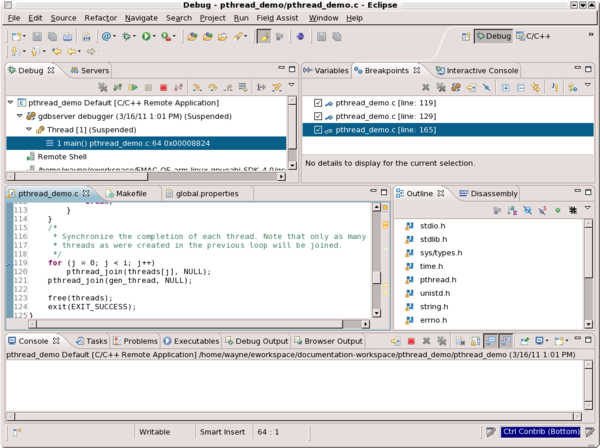
Depending on the project settings, Eclipse may attempt to perform a build as its first step. Otherwise, it will continue to the next step which is to upload the binary to the location in the remote file system specified in the Debug Configuration. It will then run that program attached to gdbserver. Eclipse will then run the SDK's architecture-specific version of GDB with the remote target specified by the hostname in the Remote Connection and the port specified in the Debug Configuration. Once all this is done, Eclipse will activate a prompt to determine whether or not it should automatically switch to the Debug Perspective. Answer yes to arrive at the workspace shown in Figure 4 below.
Lesson 2: Add Breakpoints
After starting the debug session, the next step is to add breakpoints. The procedure below covers this topic.
-
In the upper-right frame of Eclipse Views, the Variable View should be showing. Click the Breakpoints View tab to bring it into focus in that frame.
-
Click the text editor showing the pthread_demo.c source file to put it in focus.
-
Scroll to line
129. -
Right-click on the number 129 in the line number column.
-
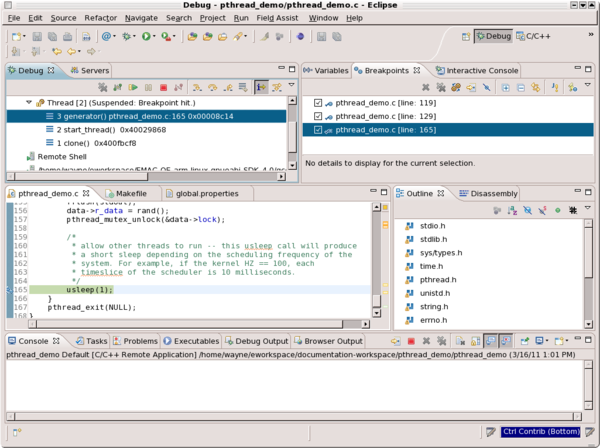
Select Toggle Breakpoint to toggle a breakpoint for that line. This causes a check mark to appear to the left of the line number as shown in Figure 5. Note that the same effect can be achieved by double-clicking the line number. Also notice that the Debug Perspective C/C++ Editor is the same editor used within the C/C++ Perspective. Because the editors are the same, the functionality of toggling breakpoints is available in the C/C++ Perspective as well as the Debug Perspective.
-
Repeat steps 3-5 for lines
119and165. Notice that each breakpoint shows up in the Breakpoints view. Right-clicking on either of these breakpoints will pull up a context menu that provides control similar to right-clicking on the breakpoint's line number. These breakpoints are local to the project being debugged so they will persist across debug sessions until removed manually in the Breakpoints View.
-
After setting the breakpoints, click Run -> Resume. The program will continue until the first breakpoint, which is line
165in the generator thread. This will yield a workbench similar to what is shown in Figure 6 below. The main thread will be suspended somewhere within the call topthread_create(). Note the thread number in brackets. This uniquely identifies threads within a program so that they may be distinguished from one another during the debug session.
Lesson 3: Switch Between Threads
After adding breakpoints, the next task is to learn how to switch between threads. The procedure below covers this topic.
-
In the Debug View, the following thread should currently be selected: pthread_demo [C/C++ Remote Application] -> gdbserver debugger (<date> This is the third stack frame in the second thread of the pthread_demo application. It is currently selected in the Eclipse Debug view because it hit the breakpoint at line
165. -
In the Eclipse window frame (not to be confused with a stack frame) which contains the Variables and Breakpoints Views, select the Variables View. Notice that the currently-selected stack frame will always be the one whose variables are shown in this view. In terms relevant to source code, a stack frame for a particular function is where its local variables are stored in the process's virtual memory space.
-
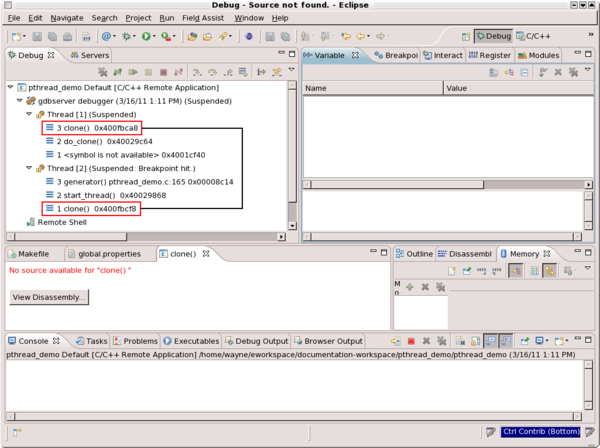
Expand Thread [1] (Suspended) as shown in Figure 7. Notice the similarity between the hex location of the current instruction in this thread and that of the first stack frame in Thread 2. These memory locations are similar because this is where the new thread splits off from the main thread. Also, note that the variables shown in the Variable View differ between these two stack frames as described in Step 2.
Lesson 4: Enable Scheduler-Locking Using the GDB Console
This lesson will demonstrate how to enable the operating system's scheduler-locking for a multi-threaded application to ensure that only a single thread is running for a given Step Into or Step Over command. For debugging most applications, direct interaction with the GDB console is not necessary. It is documented here to demonstrate its applicability in special cases of multi-threaded programs with threads whose lifetimes are especially short.
-
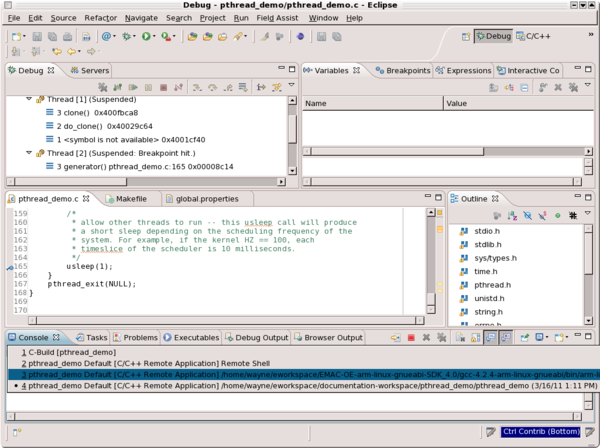
In the Console View, select the console connected to the GDB console from the Display Selected Console icon as shown in Figure 8 below. Note that the GDB console may or may not be the third console as seen in Figure 8. The GDB session can be identified by the correct EMAC OE SDK path to the GDB binary used by Eclipse to execute the program.
-
In the Console View, enter the following command:
set scheduler-locking on
This command ensures that the Step Into (F5) and Step Over (F6) commands only apply to the thread currently selected in the Debug View.
-
Click the Resume button in the Workbench:
 . This will cause the
 mainthread to iteratively create all thereaderthreads then suspend for the breakpoint at line 119. Eachreaderthread will suspend at line 129.
Lesson 5: Step Through Code
Once scheduler-locking is enabled, it is possible to step through the source code of one thread at a time. This lesson will demonstrate that functionality.
| Note that for a simple application with only one thread, scheduler locking will not be required and this lesson can be followed directly after setting breakpoints as described in Lesson 2. |
-
Select the
generatorthread. -
Click Window -> View -> Disassembly. This will switch to the Disassembly View in the frame which contains the Outline View.
-
In the Debug View, click the Step Over button:
 . Watch the Editor containing
 pthread_demo.cand the Disassembly View while doing this. Notice that the currently-running line in both thepthread_demo.cEditor and the Disassembly View is highlighted. The highlighted line in the Disassembly view advances each time the Step Over command is given while the highlighted line inpthread_demo.cremains on the statement to which each of the Disassembly View highlighted lines correspond. -
Continue stepping over until line 165 is reached once more in the
generatorthread. This will ensure that thegeneratorthread has given up the mutex lock. For a detailed description of what a mutex is, please see the EMAC OE SDK Debug Walkthrough Lesson 3. -
Select one of the
readerthreads. These are the threads whose thread number is 3 or greater in the Debug View. Step from line 129 to line 138. Notice that thereaderlocks the mutex before reading or accessing it. It also unlocks the mutex before exiting. To see the output ofgeneratorandreaderthreads, switch the Console View entry with "Remote Shell" specified at the end as shown above in Figure 8. -
To generate a new random number, select the
generatorthread once more. Then click the Resume button or press F8. This will cause thegeneratorthread to iterate through its while loop until it reaches theusleep()call at line 165 once more. -
Repeat steps 5 and 6 until each of the
readerthreads have made a call topthread_exit(). -
To finish the debug session gracefully, perform the following steps:
-
Switch to the GDB Console View once more and enter:
set scheduler-locking off
-
In the Breakpoints View, uncheck the check boxes next to each of the currently-set breakpoints.
-
Select the
mainthread. Then select Run -> Resume or press F8 to allow each of the threads to gracefully join themainthread. Once this has happened, the program will exit.
-
Other Debugging Tools
The walkthrough above demonstrates a typical but very basic usage of the Eclipse Debug Perspective. There are additional tools available through the Eclipe Debug Perspective, some of which are detailed below.
The Variable View
The Variable View allows the developer to inspect and alter the values of variables while the program is paused, including navigating data structures and dereferencing pointer locations. In addition, watchpoints can be set to pause execution when certain conditions are met. It is recommended that the Variable View be used from within the Debug Perspective. The variables are only shown during an active debug session.
Change Variable Values
To change the value of a variable:
- Right-click on the variable in the Variable View
- Select Change Value...
- Enter the new value in the Set Value dialog and then click OK.
Set Watchpoints
A watchpoint is similar to a breakpoint in that it causes program execution to pause. It differs in that instead of causing the program to suspend on a specific line, it causes the program to suspend when a specified variable is read or written during program execution. To set a watchpoint on a variable:
- Right-click on the variable in the Variable View.
- Select Add Watchpoint (C/C++).
- In the Add Watchpoint dialog, choose the Access types for which GDB should watch. This can be either or both of the values Read and Write. This tells GDB to watch for reads from or writes to the variable.
Hardware watchpoints will need to be disabled on most EMAC products using the GDB console as described in Lesson 4 above. Use the following command to disable hardware watchpoints: set can-use-hw-watchpoints 0 |
Using the Memory Monitor
The Memory Monitor is a tool that allows the developer to see changes to adjacent portions of memory while stepping through source code. The changes show up as memory values highlighted in red as seen below in Figure 9.
| Note that the Memory Monitor View normally appears in the same Eclipse workbench frame as the Console view but was enlarged and singled out for demonstration in this guide. |
To view a specific location in memory corresponding to a program variable:
- Activate the Variable View in the Eclipse workbench.
- Right-click on the Variable whose location is to be examined, then select View Memory in the context menu.
The Memory Monitor can support multiple "Renderings" of a particular memory location. Each type of rendering is a different way to represent the values of the memory locations. Memory locations can be viewed as Hex, ASCII, Signed Integer, Unsigned Integer, Hex Integer, or Traditional. To view a different rendering of the same memory location, click the New Renderings... tab in the Memory Monitor View. Figure 10 below shows the "Traditional" Rendering which shows three panes: Address, Binary, and Text.
The Disassembly View
In some cases, it is necessary to go deeper into a program than the source code to understand what is going on. In these cases, it is useful to set the Eclipse debugger to Instruction Stepping Mode and observe the location of the instruction pointer while the program is suspended. This can provide an insight into the way a line of source code is compiled into machine instructions, for example on a line with complex logic operations inside a conditional block.
Instruction Stepping
Instruction stepping alters the functionality of the Step Into and Step Over GUI commands so that they step line-by-line through the program's disassembled code rather than through its source code. To enable instruction stepping, click the Instruction Stepping Mode button in the Debug View: ![]()
The Register View
The Register View provides about as deep an insight into what the program is really doing as possible. This view shows what values the various registers in the target machine's processor currently hold at this point in the program's execution. These can be viewed or altered just like source code variables.
| Be careful when changing register values as this can drastically alter the functioning of the system. In particular, care should be taken with instruction and data addresses. Modifying these values requires advanced knowledge of the relationship between CPU architecture, physical memory, and the operating system's virtual memory. |
